Sidebar
What can I choose in the calculator?
Hydro Dam Installed Power

Contents
- Impact
- Global market
- Definition
- Constraints
- Assumptions
- Value range
- References
IMPACT – What are the impacts of Hydro Dam power?
Energy system
![]() Increase the electricity storage capacity and reduce the electricity deficit.
Increase the electricity storage capacity and reduce the electricity deficit.
![]() Increase energy independence and energy security.
Increase energy independence and energy security.
![]() Increase the share of renewable energy sources in the energy mix.
Increase the share of renewable energy sources in the energy mix.
Environment & Climate
![]() Reduce global CO2 emissions.
Reduce global CO2 emissions.
![]() Fish migration is affected by dams and fish can also be killed by turbines.
Fish migration is affected by dams and fish can also be killed by turbines.
![]() Increase impacts on wildlife when an artificial lake is created.
Increase impacts on wildlife when an artificial lake is created.
![]() Increase evaporation hence disturbance to local climate.
Increase evaporation hence disturbance to local climate.
![]() Increase pressure on downstream aquatic ecosystems through discharge fluctuations.
Increase pressure on downstream aquatic ecosystems through discharge fluctuations.
![]() Likely to increase deposited waste over the long term due to large volumes of concrete.
Likely to increase deposited waste over the long term due to large volumes of concrete.
Society & Economy
![]() Likely to reduce the cost of the energy transition though upfront investment costs are high.
Likely to reduce the cost of the energy transition though upfront investment costs are high.
![]() Pumped hydro systems enable arbitrage between (low) imported power prices and (high) exported prices.
Pumped hydro systems enable arbitrage between (low) imported power prices and (high) exported prices.
![]() Dams can help regulate water levels downstream and reduce the risk of flooding after intensive precipitation in the catchment area.
Dams can help regulate water levels downstream and reduce the risk of flooding after intensive precipitation in the catchment area.
![]() The unlikely event of a failing dam poses a flash flood risk.
The unlikely event of a failing dam poses a flash flood risk.
![]() Dams can hamper inland shipping movements.
Dams can hamper inland shipping movements.
GLOBAL MARKET – What is the global market for Hydro Dam power?
DEFINITION / CONSTRAINTS
DEFINITION - What is Hydro Dam power?
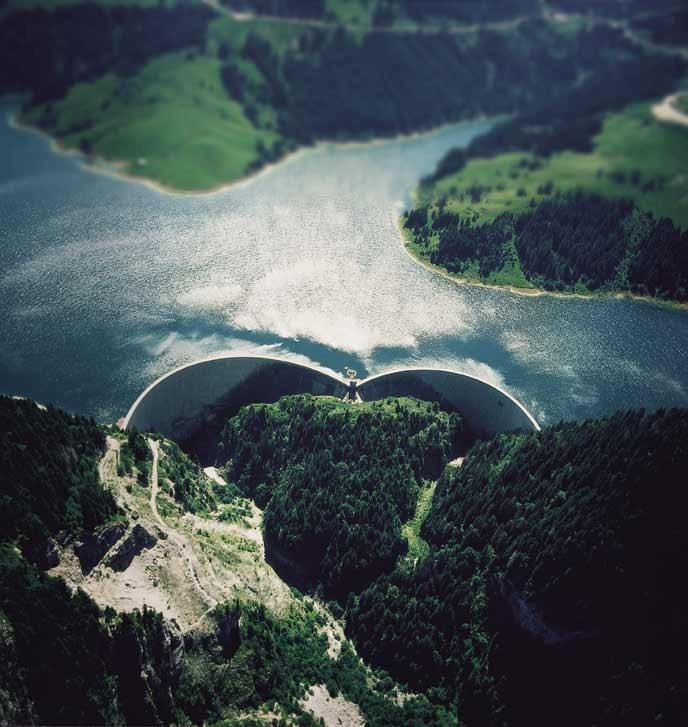
Hydro Dam power refers to the utilisation of the gravitational potential energy contained in a water reservoir created by a dam.
The water is directed through turbines that are connected to a generator to produce electricity.
A distinction should be made between conventional, one-way, hydro power systems and systems with two reservoirs at different levels connected by pipes. The latter configuration is a way to store large amount of electricity (with 80% efficiency) by using it to pump water from the lower to the higher reservoir.
CONSTRAINTS - What are the key barriers facing the increase of Appliances Efficiency?
• Requires geographically suitable catchment areas that have to be closed by a dam to create an artificial basin; the most suitable locations have already been used in Switzerland as well as many developed countries.
• The general impacts of dam schemes are widely understood (large flooded areas, population displacement, modifications of downriver water flow …) and potential projects are therefore closely scrutinised
• Hydro projects that require the construction of (large) dams have high upfront investment costs.
Next tables contain the assumptions that have been introduced in the Hydro dam model of the calculator.
| Capacity factor | ||
|---|---|---|
| 2011 | 2035 | 2050 |
| 0.244 | 0.244 | 0.244 |
| Electricity production distribution * | |
|---|---|
| Winter | Summer |
| 48% | 52% |
*This electricity production distribution might vary depending on the scenario. For more information on this subject go to Electricity production distribution.
| Emissions | |
|---|---|
| 2011-2050 | |
| CO2-eq. emissions [kgCO2-eq./kWhe] | 0.00530 |
| Deposited waste [UBP/kWhe] | 0.449 |
Click for detailed description
MIN Value: 8.1 GW [2]. It corresponds to the installed capacity in 2011.
MAX Value:
| 2035 | 8.2GW | The maximum potential is estimated to be 17.48 TWh, produced by 8.18 GW (Capacity factor = 0.244). |
|---|---|---|
| 2050 |
[1] IEA 2012, Technology Roadmap: Hydropower.
[2] Statistique des aménagements hydroélectriques de la Suisse


