
")

")

Sidebar
en:wind_energy_more
What can I choose in the calculator?
The calculator lets you choose the share of Wind energy in the total electricity generation capacity in Switzerland in the selected year (2035 or 2050).
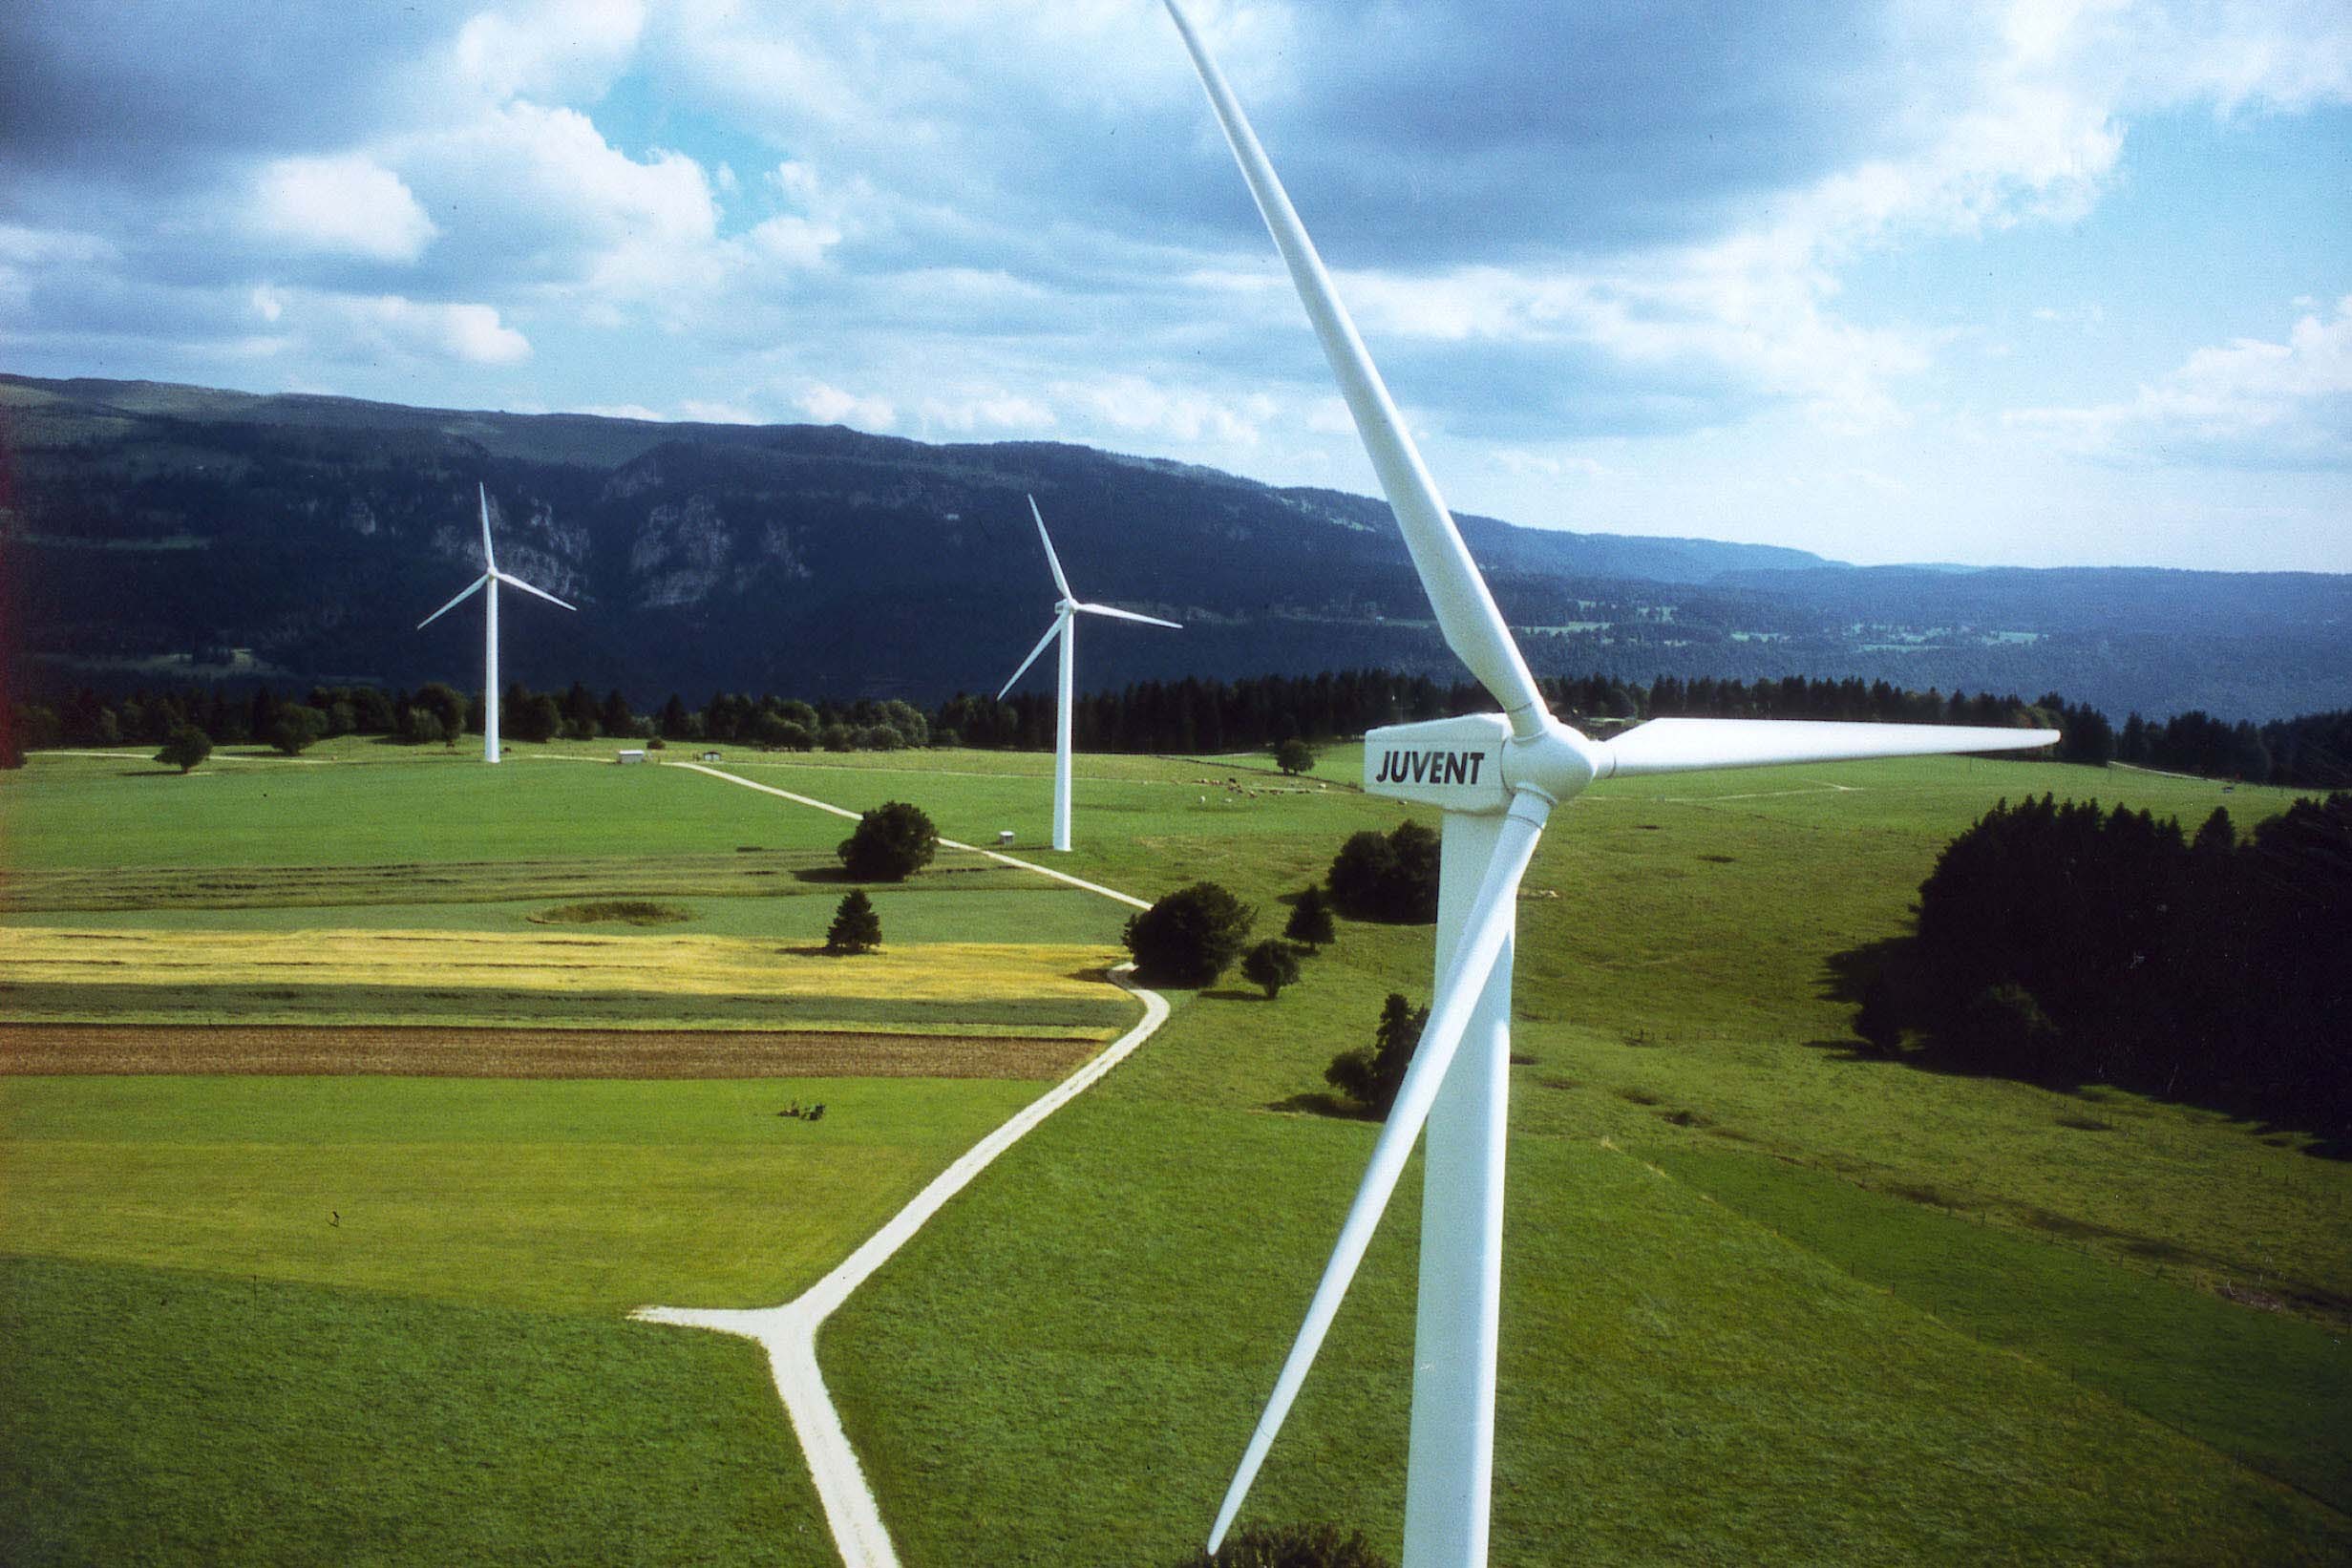
Wind Energy
Contents
- Impact
- Global market
- Definition
- Constraints
- Assumptions
- Value range
- References
IMPACT – What are the impacts of Wind energy?
In Switzerland, increasing the share of Wind energy in the total electricity generation capacity will have the following impacts:
Energy system
![]() Increase the share of renewable energy sources in the energy mix.
Increase the share of renewable energy sources in the energy mix.
![]() Increase pressure on the grid by increasing non-dispatchable electricity generation.
Increase pressure on the grid by increasing non-dispatchable electricity generation.
![]() Likely to increase energy independence and energy security by reducing fossil imports.
Likely to increase energy independence and energy security by reducing fossil imports.
Environment & Climate
![]() Reduce global CO2 emissions.
Reduce global CO2 emissions.
![]() Minimal impact from end-of-life components, which can mainly be recycled.
Minimal impact from end-of-life components, which can mainly be recycled.
![]() Visual intrusion is significant if placed on ridges and hilltops where wind resources are strongest. If placed too close to habitations there is potential noise disturbances.
Visual intrusion is significant if placed on ridges and hilltops where wind resources are strongest. If placed too close to habitations there is potential noise disturbances.
![]() Wind turbines can disturb migratory routes for birds and upset sea life offshore. They can also cause interference with radar systems.
Wind turbines can disturb migratory routes for birds and upset sea life offshore. They can also cause interference with radar systems.
Society & Economy
![]() Direct impacts on the cost of the energy transition are limited as wind turbines are cost competitive in windy settings. However, indirect costs of integrating wind at high shares are not well understood and may increase the cost of the energy transition.
Direct impacts on the cost of the energy transition are limited as wind turbines are cost competitive in windy settings. However, indirect costs of integrating wind at high shares are not well understood and may increase the cost of the energy transition.
![]() May improve balance of payments by substituting imported energy by domestic electricity.
May improve balance of payments by substituting imported energy by domestic electricity.
GLOBAL MARKET – What is the global market for Wind energy?
Global installed wind capacity at the end of 2011 was around 238 GW, up from 18 GW at the end of the year 2000. Around 41 GW were added in 2011 alone. In recent years, wind centre of growth moved from Europe and North America to Asia, which emerged as the global leader. China became the global leader in terms of total installed capacity in a very short time, overtaking the United States in 2010.[3]
DEFINITION / CONSTRAINTS
DEFINITION - What is Wind energy?
Electricity can be generated by wind turbines at a wide range of scales and using different designs. The dominant concept that emerged during the 1990s is the structurally stiff, 3-bladed rotor, upwind design. This design can be deployed globally at scales ranging from a few kW to several MW. Small turbines can be fixed to buildings or mounted on poles near remote buildings, for example. Large wind farms employ several hundred MW-scale turbines.
Where conditions permit, wind turbines are increasingly sited offshore in view of their visual intrusion and thanks to normally high and relatively constant offshore wind speeds.
CONSTRAINTS - What are the key barriers facing Wind energy deployment?
• For larger turbines it is hard to find sites that offer an acceptable compromise between wind speed, visual intrusion, grid connection cost, and other factors.
• Grid operators are wary of accepting high level shares of wind generation in the absence of means to balance the grid in the event of shortfalls.
• Smaller turbines in low wind settings are rarely economic.
Next tables contain the assumptions that have been introduced in the Wind energy model of the calculator.
| Capacity factor | ||
|---|---|---|
| 2011 | 2035 | 2050 |
| 0.23 | 0.25 | 0.27 |
| Monthly distribution [1] | |||||||||||
|---|---|---|---|---|---|---|---|---|---|---|---|
| J | F | M | A | M | J | J | A | S | O | N | D |
| 0.120 | 0.093 | 0.104 | 0.065 | 0.065 | 0.050 | 0.055 | 0.050 | 0.058 | 0.103 | 0.112 | 0.125 |
| Emissions | |||
|---|---|---|---|
| 2011 | 2035 | 2050 | |
| CO2-eq. emissions [kgCO2-eq./kWhe] | 0.0161 | 0.00903 | 0.00836 |
| Deposited waste [UBP/kWhe] | 1.89 | 1.06 | 0.979 |
| Cost | |||
|---|---|---|---|
| 2011 | 2035 | 2050 | |
| Specific investment [CHF/kWe] | 2'008 | 1'693 | 1'644 |
MIN Value: 0 GW
MAX Value:
| 2035 | 4.5GW | The maxumum potential is estimated to be 10 TWh [2], produced by 4.23 GW (Capacity factor = 0.27). This is equivalent to about 185 wind turbine parks with 5 to 10 turbines. These parks would cover 0.54% of the Swiss surface. |
|---|---|---|
| 2050 |
[1] Juvent website (wind turbines in Jura)
[2] Suisse Eole (2012), Potentiels et buts de l’énergie éolienne en Suisse.
[3] International Energy Agency
You could leave a comment if you were logged in.
en/wind_energy_more.txt · Last modified: 2023/11/16 15:21 by 127.0.0.1