Sidebar
What can I choose in the calculator?
Photovoltaic

Contents
- Impact
- Global market
- Definition
- Constraints
- Assumptions
- Value range
IMPACT – What are the impacts of Photovoltaic energy?
Energy system
![]() Increase the share of renewable energy sources in the energy mix.
Increase the share of renewable energy sources in the energy mix.
![]() At very high shares, the seasonal supply-demand gap (excess generation in summer and generation shortage in winter) can become problematic.
At very high shares, the seasonal supply-demand gap (excess generation in summer and generation shortage in winter) can become problematic.
![]() Increase pressure on the grid by increasing non-dispatchable electricity generation.
Increase pressure on the grid by increasing non-dispatchable electricity generation.
![]() No effect on final energy consumption.
No effect on final energy consumption.
![]() Can increase energy independence and energy security.
Can increase energy independence and energy security.
Environment & Climate
![]() Reduces global CO2 emissions.
Reduces global CO2 emissions.
![]() Likely to increase deposited waste and environmental impacts related to mining and end of life treatment of PV panels.
Likely to increase deposited waste and environmental impacts related to mining and end of life treatment of PV panels.
![]() Can increase pressure on land availability, unless limited to roof-top and other unused areas.
Can increase pressure on land availability, unless limited to roof-top and other unused areas.
Society & Economy
![]() Direct impacts on the cost of the energy transition are limited as PV technology is becoming cheaper. However, indirect costs of integrating PV at high shares are not well understood and may increase the cost of the energy transition.
Direct impacts on the cost of the energy transition are limited as PV technology is becoming cheaper. However, indirect costs of integrating PV at high shares are not well understood and may increase the cost of the energy transition.
![]() May increase the acceptance of the energy transition through increased awareness of electricity consumers who become from time to time also electricity producers.
May increase the acceptance of the energy transition through increased awareness of electricity consumers who become from time to time also electricity producers.
![]() May improve balance of payments by substituting imported energy by domestic electricity.
May improve balance of payments by substituting imported energy by domestic electricity.
![]() Self-consumption of produced PV electricity can increase electricity levies for all other electricity consumers (fewer kWhs to spread the cost).
Self-consumption of produced PV electricity can increase electricity levies for all other electricity consumers (fewer kWhs to spread the cost).
GLOBAL MARKET – What is the global market for Photovoltaic energy?
DEFINITION / CONSTRAINTS
DEFINITION - What is Photovoltaic energy?
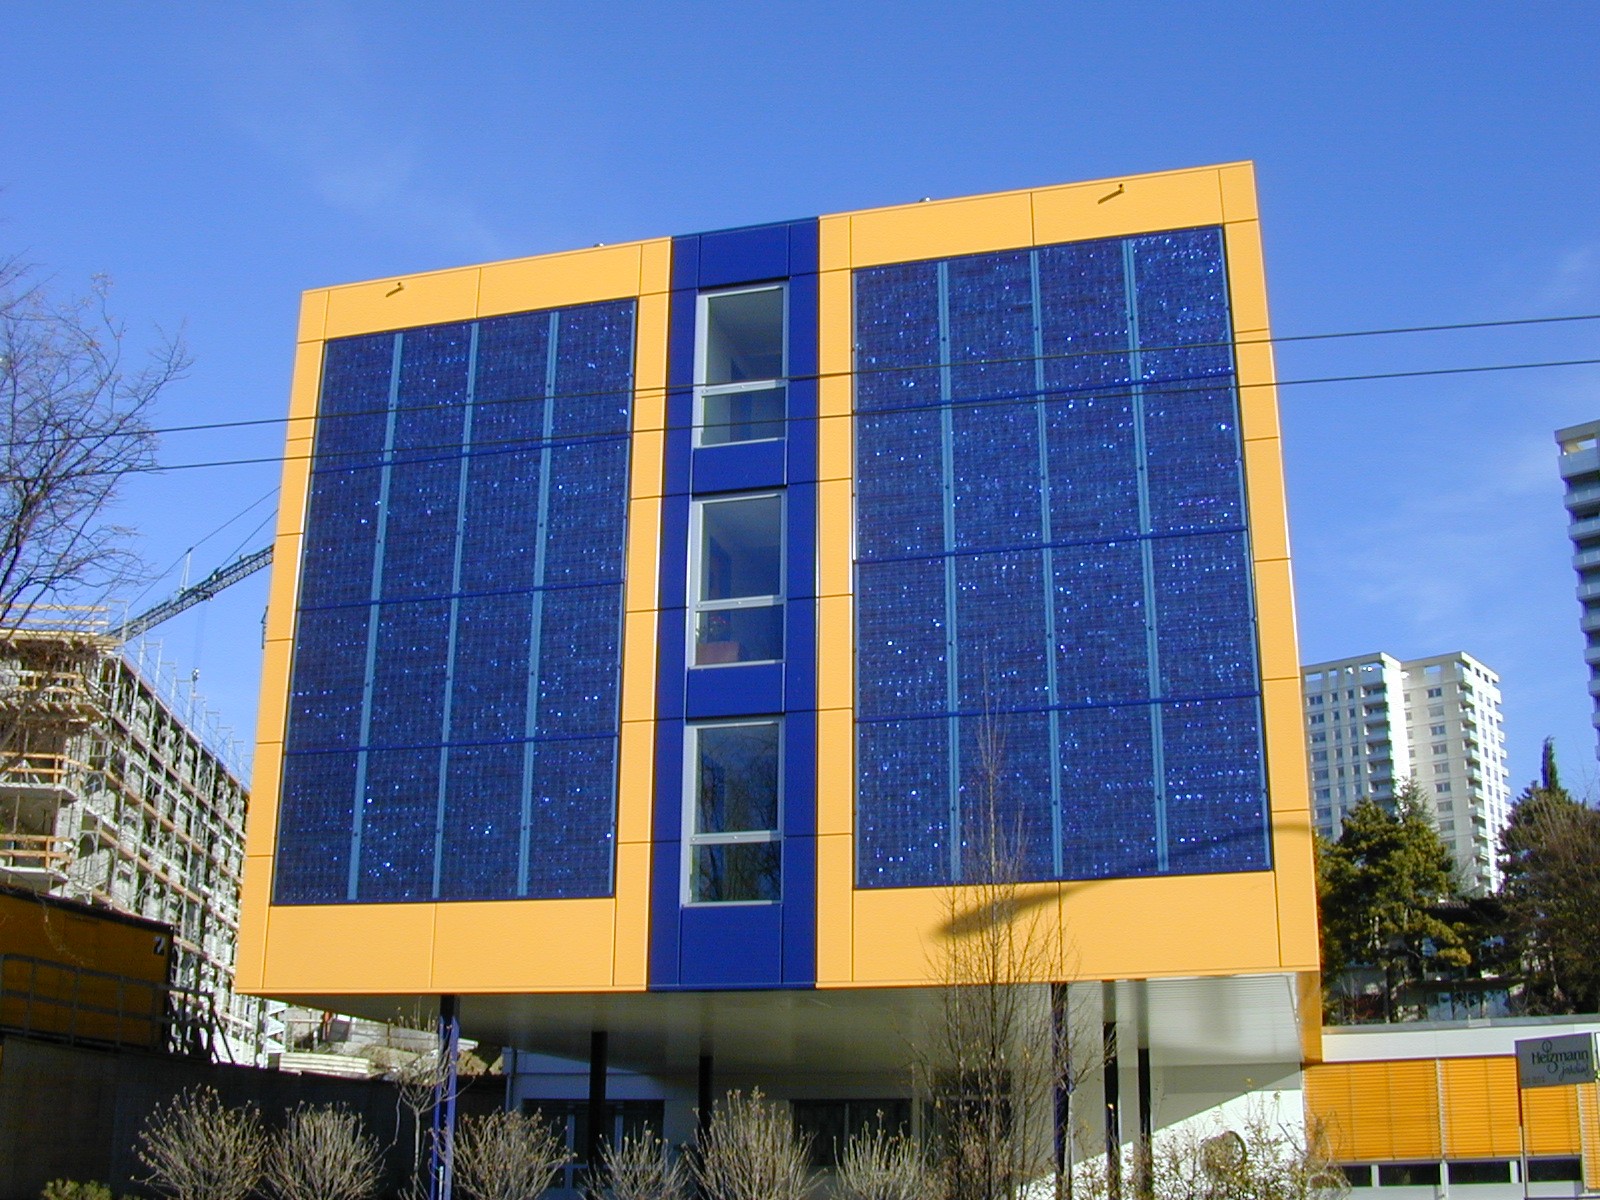
Photovoltaic energy refers to the direct conversion of solar radiation into direct current power. PV panels are made up of cells which contain a material (often silicon-based) which releases electrons in response to light.
PV panels can be used singly, or in arrays providing a power ofup to several MW. The majority of PV arrays today are grid connected and thus require a DC-AC converter.
The nominal capacity (kW) of a PV system is a calculated value based on defined standard benchmark conditions. Depending on the location, one kW of installed PV may typically generate between 800 and 2,500 kWh in one year.
CONSTRAINTS - What are the key barriers facing Photovoltaic energy deployment?
• Generation of PV electricity does not follow the fluctuations in time of the demand in most world regions (day-night, winter-summer) so large scale deployment of PV needs to be combined with measures such as storage that can balance supply and demand.
• While PV module costs and prices have fallen significantly in recent years, installed system cost (incl. mounting, electric installations, current inverter and project development) still poses a barrier to deployment.
• Permitting of PV plants and grid connection is a key barrier to PV deployment in some countries.
• Availability of roof area suitable for PV can become a limiting factor in achieving high PV shares. Systems installed on ‘green’ fields may cause public resistance.
• It can be challenging to sell PV electricity with sufficient margin in a merit- order based market. Incentives may therefore persist even at very low levelized cost of PV electricity.
ASSUMPTIONS – What are the assumptions considered in the calculator?
Next tables contain the assumptions that have been introduced in the Photovoltaic energy model of the calculator.
| Capacity factor | ||
|---|---|---|
| 2011 | 2035 | 2050 |
| 0.113 | 0.113 | 0.113 |
| Monthly distribution* | |||||||||||
|---|---|---|---|---|---|---|---|---|---|---|---|
| J | F | M | A | M | J | J | A | S | O | N | D |
| 0.040 | 0.064 | 0.090 | 0.111 | 0.117 | 0.114 | 0.123 | 0.117 | 0.093 | 0.066 | 0.038 | 0.027 |
*Based on the actual PV electricity production for the “Mittenland” [1].
| Efficiency [%] | ||
|---|---|---|
| 2011 | 2035 | 2050 |
| 16 | 25 | |
| Emissions | |||
|---|---|---|---|
| 2011 | 2035 | 2050 | |
| CO2-eq. emissions [kgCO2-eq./kWhe] | 0.0625 | 0.0334 | 0.0179 |
| Deposited waste [UBP/kWhe] | 7.87 | 4.20 | 2.25 |
| Cost | |||
|---|---|---|---|
| 2011 | 2035 | 2050 | |
| Specific investment [CHF/kWe] | 3'750 | 2'214 | 1'824 |
MIN Value: 0 GW
MAX Value:
| 2035 | 25GW | The potential for 2035-2050 is estimated to be 25 TWh (More information), produced by 25 GW (Capacity factor = 0.113). The required surface for the panels represents 40% of the actual appropiate roofs and façades surface for PV panels installation in Switzerland. |
|---|---|---|
| 2050 |
[2] IEA(2010), Technology roadmap, Solar photovoltaic energy.
[3] Swissolar (2012), Comment produire 20% d’électricité solaire en 2025.
[4] VSE (2012), Electricité photovoltaïque et solaire thermique.
[5] PVPS Report: Snapshot of Global PV 1992-2013
[6] International Energy Agency, World Energy Outlook 2013


