
No renderer 'pdf' found for mode 'pdf'
")

")

Sidebar
en:hydro_river_more_2
What can I choose in the calculator?
The calculator lets you choose the share of River Hydro power in the total electricity production capacity in Switzerland in the selected year (2035 or 2050).
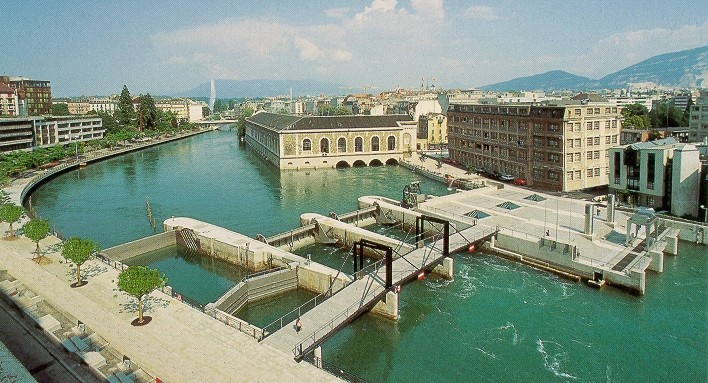
Run-of-the-river Hydro
Contents
- Impact
- Global market
- Definition
- Constraints
- Assumptions
- Value range
- References
IMPACT – What are the impacts of Run-of-the-river Hydropower?
In Switzerland, increasing the share of Run-of-the-river Hydropower in the total electricity production capacity will have the following impacts:
Energy system
![]() Increase energy independence and energy security.
Increase energy independence and energy security.
![]() Increase the share of renewable energy sources in the energy mix.
Increase the share of renewable energy sources in the energy mix.
![]() May increase seasonal electricity deficit due to variations in discharge levels.
May increase seasonal electricity deficit due to variations in discharge levels.
![]() May decrease daily electricity deficit by adapting to the load demand profile.
May decrease daily electricity deficit by adapting to the load demand profile.
Environment & Climate
![]() Reduce global CO2 emissions.
Reduce global CO2 emissions.
![]() Increase pressure on aquatic life by hampering fish migration. Though fish by-passes can alleviate the pressure more easily in the absence of a large dam.
Increase pressure on aquatic life by hampering fish migration. Though fish by-passes can alleviate the pressure more easily in the absence of a large dam.
Society & Economy
![]() Likely to reduce the cost of the energy transition.
Likely to reduce the cost of the energy transition.
![]() No flash flood risk as with hydro dams
No flash flood risk as with hydro dams
![]() Relatively low upfront investment costs.
Relatively low upfront investment costs.
GLOBAL MARKET – What is the global market for Run-of-the-river Hydropower?
Hydropower is the most common form of renewable electricity and with around 3,500 TWh generated in 2010, hydropower accounted for 16.3% of the global electricity production. Hydropower plants of capacity lower than 10 MW (of which most is run-of-river hydropower) are estimated to represent about 10% of the global hydropower capacity. The global hydropower capacity could reach 2,000 GW in 2050, a doubling compared to 2010.[1]
DEFINITION / CONSTRAINTS
DEFINITION - What is Run-of-the-river Hydropower?
Run-of-the-river hydro power refers to the utilisation of the kinetic energy contained in a river current. The technology makes use of a naturally occurring head (the difference between the upstream and downstream water levels) that is often <30 m; no dam is used to increase the head, though special channels may be created and in some cases an upstream storage pond may improve operation.
The water is directed through turbines inserted in the river current that are connected to a generator to produce electricity.
In the absence of water storage capacity upstream, water is directed through a by-pass in times of excessive flow in the river upstream of the installation.
CONSTRAINTS - What are the key barriers facing the increase of Appliances Efficiency?
• The most suitable locations for run-of-the-river hydropower have long been used.
• The output of run-of-the-river hydro power schemes is a function of river flows and hence rainfall. This is in great part unpredictable at a weekly and monthly level making their economics and availability uncertain.
Next tables contain the assumptions that have been introduced in the Hydro river model of the calculator.
| Capacity factor | ||
|---|---|---|
| 2011 | 2035 | 2050 |
| 0.507 | 0.507 | 0.507 |
| Electricity production distribution | |
|---|---|
| Winter | Summer |
| 33% | 67% |
| Emissions | |
|---|---|
| 2011-2050 | |
| CO2-eq. emissions [kgCO2-eq./kWhe] | 0.00354 |
| Deposited waste [UBP/kWhe] | 0.280 |
Click for detailed description
MIN Value: 3.8 GW[2], It corresponds to the installed power in 2011.
MAX Value:
| 2035 | 4.5GW | The potential for 2035 is estimated to be 18.73 TWh, produced by 4.22 GW (Capacity factor = 0.507). |
|---|---|---|
| 2050 |
[1] IEA 2012, Technology Roadmap: Hydropower
[2] Statistique des aménagements hydroélectriques de la Suisse
You could leave a comment if you were logged in.
en/hydro_river_more_2.txt · Last modified: 2023/11/16 15:21 by 127.0.0.1